Tracing
Tracing is the act of following what happens when a request is made to an application. The Genesis Tracing module enables you to generate tracing data for your application through an integration with industry-standard OpenTelemetry.
OpenTelemetry is an Observability framework and toolkit designed to create and manage telemetry data, such as traces, metrics, and logs. This data enables you to understand the internal state of a system and the way that the server responds to requests from the front end.
The OpenTelemetry Java agent dynamically injects bytecode to capture telemetry from a number of popular libraries and frameworks. Genesis takes advantage of this, along with its own manual instrumentation. You can read more about the OpenTelemetry Java agent here.
OpenTelemetry also provides metrics collection capabilities. For more information about using OpenTelemetry for metrics in Genesis applications, see the Metrics documentation.
What's instrumented
Data is generated on the following activities (is instrumented, as OpenTelemetry would say):
- Inbound messages over HTTP and WebSockets
- Inter-process messaging
- JDBC operations (if using a SQL database)
Span attributes
OpenTelemetry organizes data within spans. A span is a unit of work or operation. It tracks specific operations that a request makes, so that you can see what happened during the time in which that operation was executed.
Each span contains a number of attributes. For instance, an HTTP request span has attributes detailing status code, http method etc. The following Genesis-specific attributes are added to the inbound message spans:
- Message Type
- Source Ref
- Username (if present)
- Payload
The table below shows example values for the Genesis-specific attributes listed above. Screenshots of traces in Zipkin can be seen at the bottom of the page.
| Attribute | Value |
|---|---|
| genesis.message_type | EVENT_TRADE_INSERT |
| genesis.source_ref | 6045bdfffe1177d3-00005df4-00000004-1f1e5fe74723987e-c672dc68:1 |
| genesis.username | DonDolle |
| genesis.payload | {"MESSAGE_TYPE":"EVENT_TRADE_INSERT","USER_NAME":"DoneDolle","SESSION_AUTH_TOKEN":"********","REFRESH_AUTH_TOKEN":null,"VALIDATE":false,"IGNORE_WARNINGS":true,"DETAILS":{"INSTRUMENT_ID":"VOD","COUNTERPARTY_ID":"GENESIS","QUANTITY":10,"PRICE":1.5,"SIDE":"BUY"},"SOURCE_REF":"1"} |
Enabling OpenTelemetry
To enable the OpenTelemetry Java Agent for your application, add the following settings to your system definition file:
item(name = "OpenTelemetryJavaAgentEnabled", value = "true")
item(name = "OpenTelemetryServiceNameEnabled", value = "true")
item(name = "OpenTelemetryJavaAgentPropertiesFilePath", value = "/path/to/otel-config.properties")
| Property | Default | Explanation |
|---|---|---|
| OpenTelemetryJavaAgentEnabled | false | enables the OpenTelemetry Java Agent for your application |
| OpenTelemetryServiceNameEnabled | true | automatically sets the service name to the process name (when enabled) |
| OpenTelemetryJavaAgentPropertiesFilePath | n/a | path to an OpenTelemetry Java Agent configuration properties file (optional) |
When enabled, the platform automatically:
- Attaches the OpenTelemetry Java Agent JAR from
$GENESIS_HOME/genesis/lib/opentelemetry-javaagent.jar - Sets the service name to the process name using
-Dotel.service.name={processName}(whenOpenTelemetryServiceNameEnabledistrue) - Configures the agent using the provided properties file path (if specified) via
-Dotel.javaagent.configuration-file={path}
OpenTelemetry Configuration
You can provide additional OpenTelemetry configuration through a properties file. This file allows you to configure exporters, sampling rates, resource attributes, and many other OpenTelemetry options.
Example otel-config.properties file for tracing with Zipkin:
otel.traces.exporter=zipkin
otel.metrics.exporter=none
otel.logs.exporter=none
otel.exporter.zipkin.endpoint=http://localhost:9411/api/v2/spans
In the example above, metrics exporting has been disabled. This is because, by default, the agent will try and export metrics that can pollute the Genesis logs.
Example otel-config.properties file for tracing with OTLP:
otel.traces.exporter=otlp
otel.metrics.exporter=none
otel.logs.exporter=none
otel.exporter.otlp.traces.enabled=true
otel.exporter.otlp.protocol=http/protobuf
otel.exporter.otlp.endpoint=http://localhost:4318
Alternatively you can configure the OpenTelemetry agent by providing the options to the system definition JVM_OPTIONS property alongside your existing JVM arguments. The platform appends this value to every process defined in the environment.
item(
    name = "JVM_OPTIONS",
    value = "-Dotel.traces.exporter=otlp -Dotel.metrics.exporter=none -Dotel.exporter.otlp.traces.enabled=true"
)
For a complete list of available configuration options, refer to the OpenTelemetry Java Instrumentation documentation.
Gradle Configuration (Local Development)
For local development, you can configure OpenTelemetry in your build.gradle.kts file using the genesisExec extension:
genesisExec {
    openTelemetry {
        enabled = true
        serviceNameEnabled = true
        extraOptions = "-Dotel.traces.exporter=zipkin -Dotel.metrics.exporter=none"
        propertiesFilePath = "/path/to/otel-config.properties"
    }
}
See the Exec Plugin documentation for more details on local development configuration.
Example screenshots
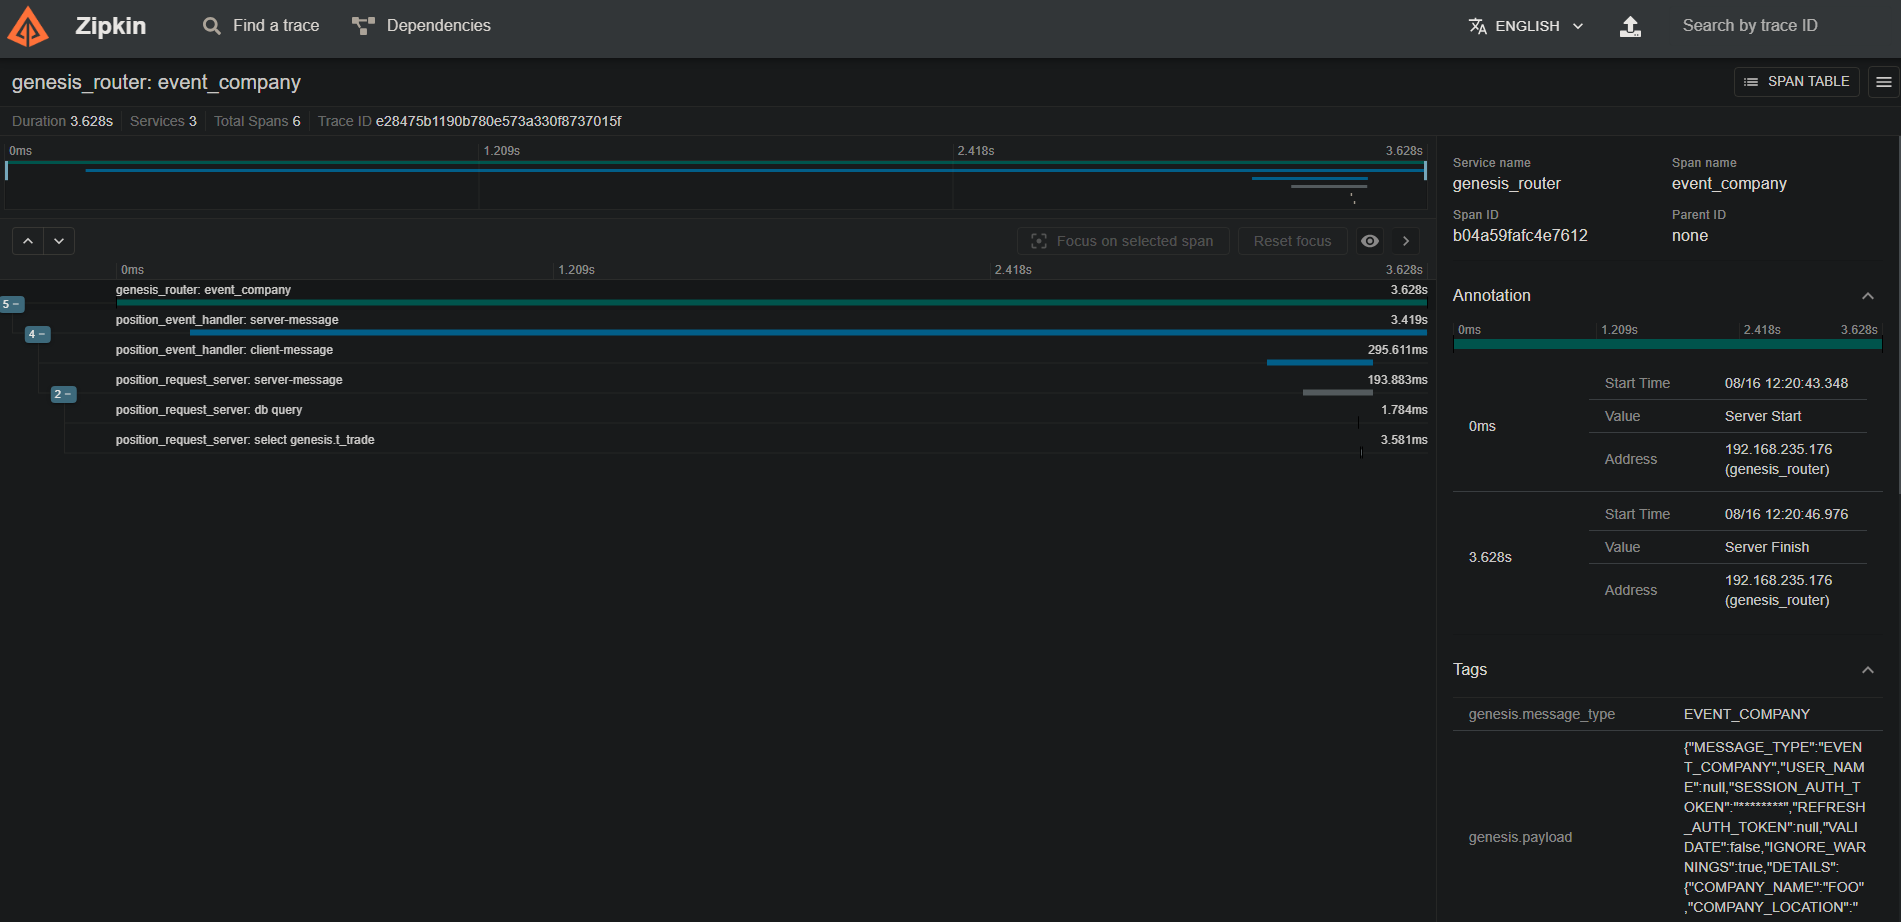
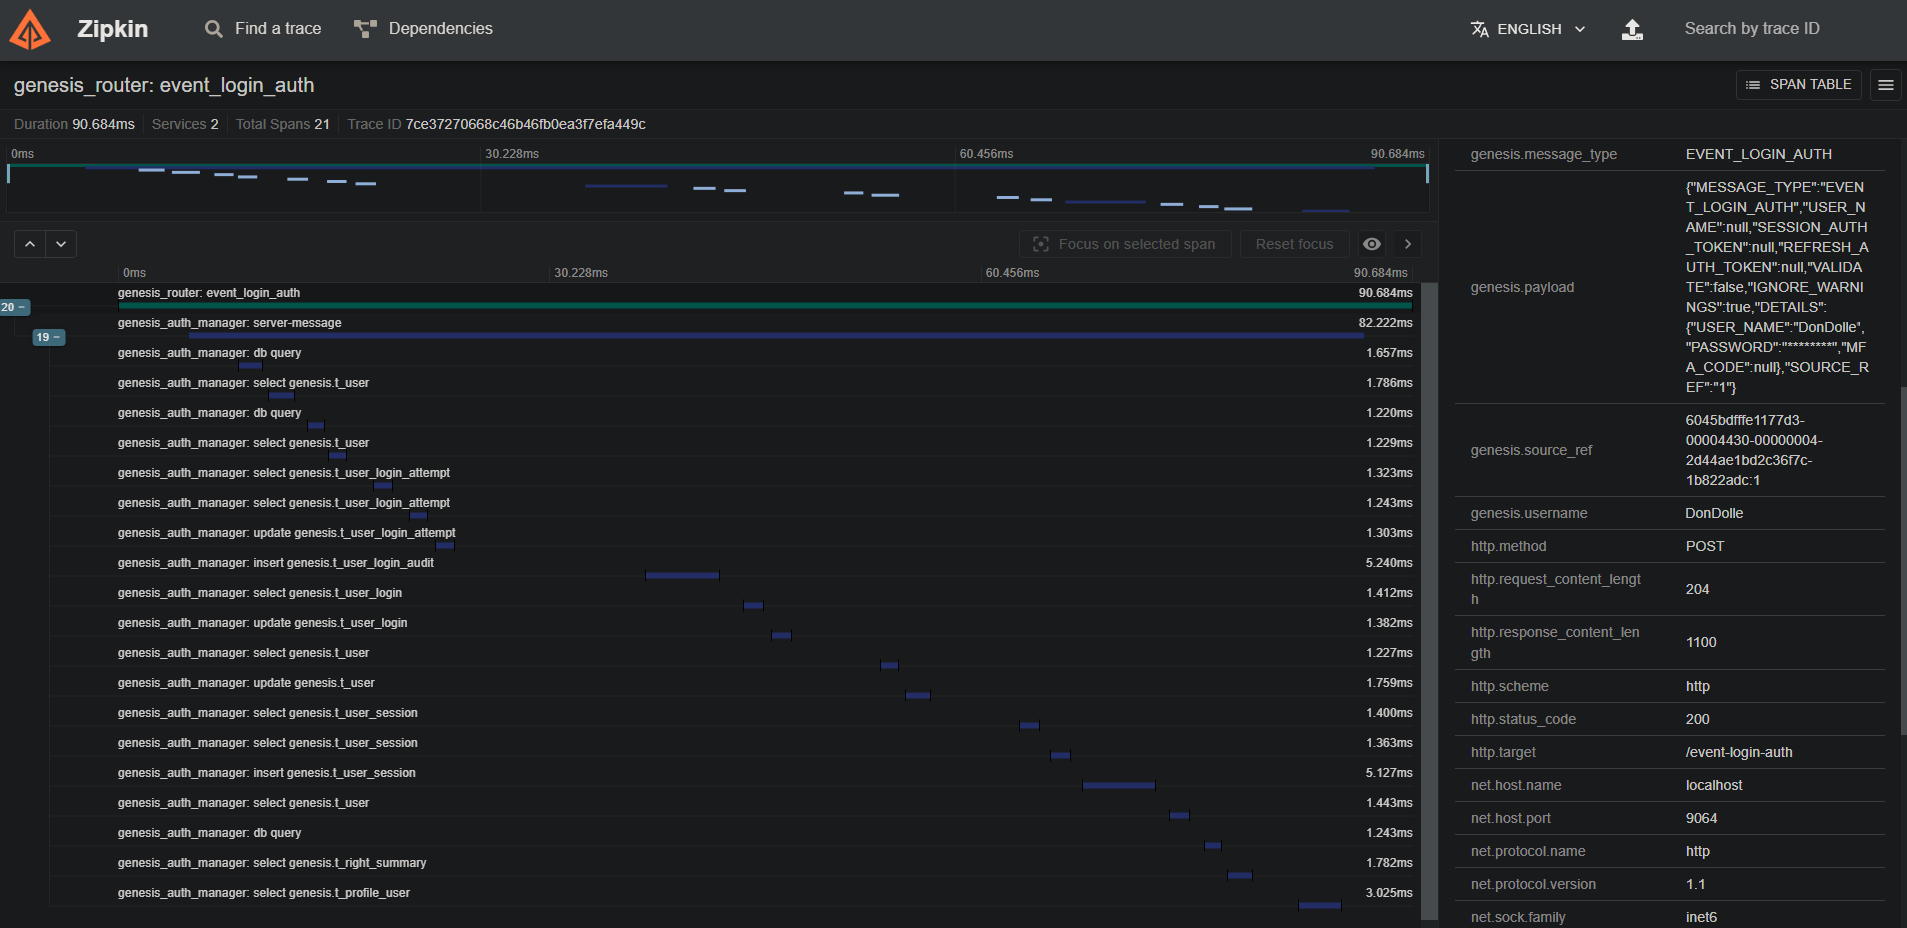
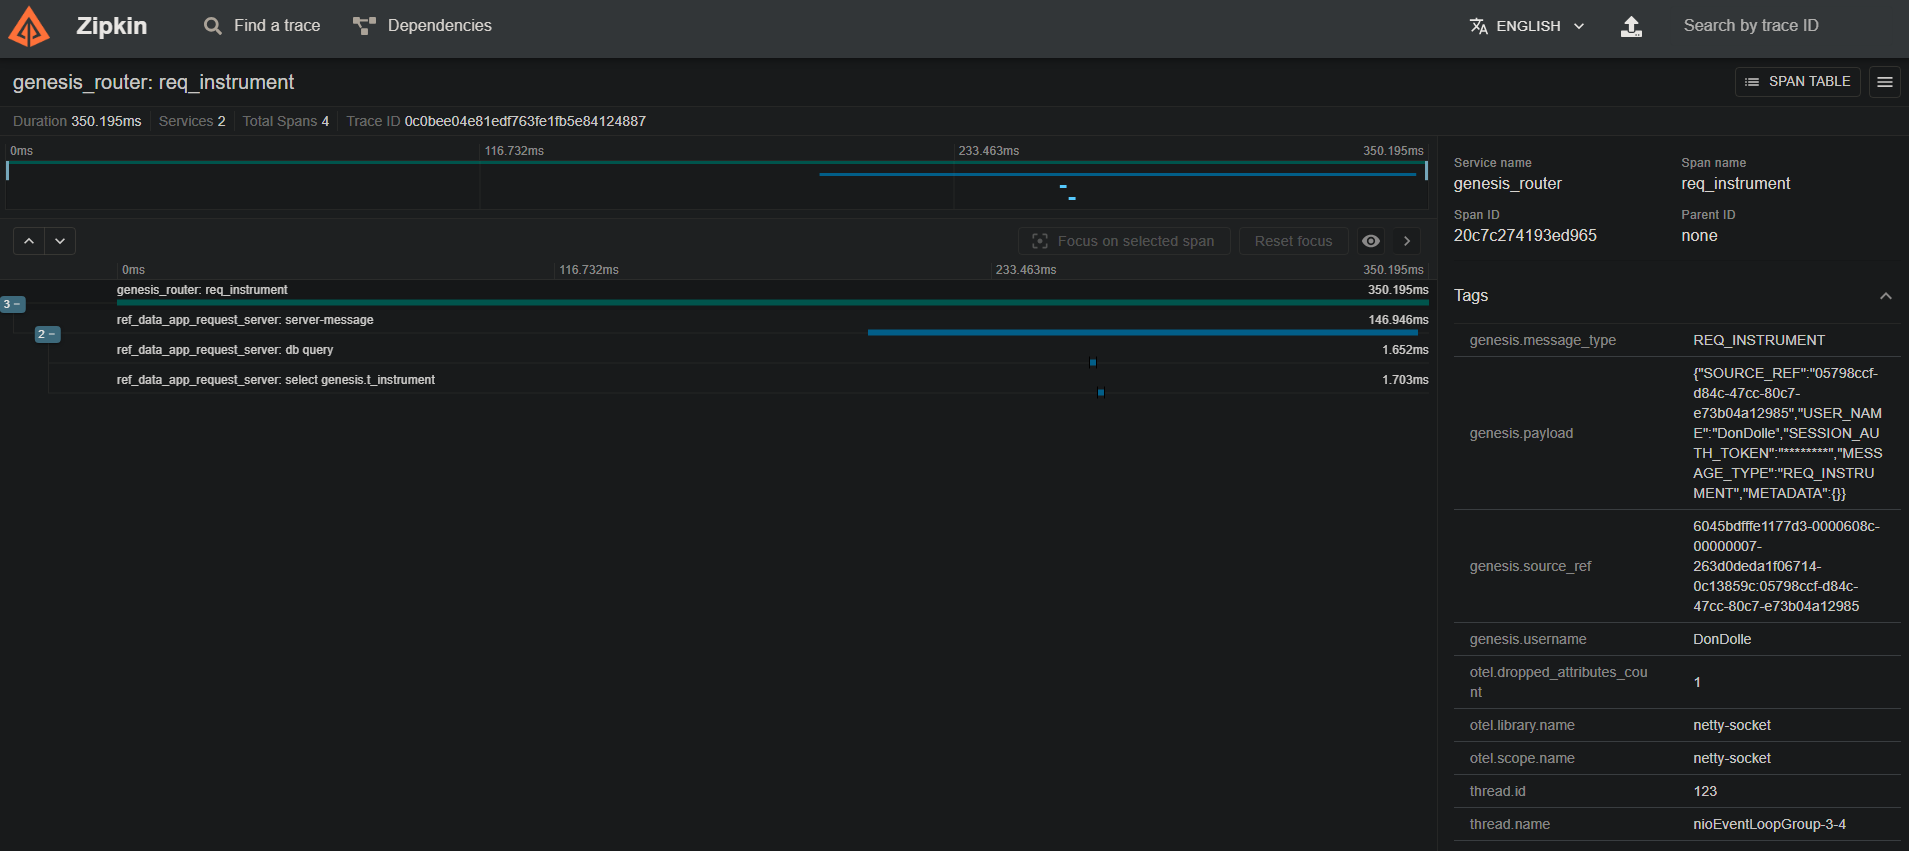
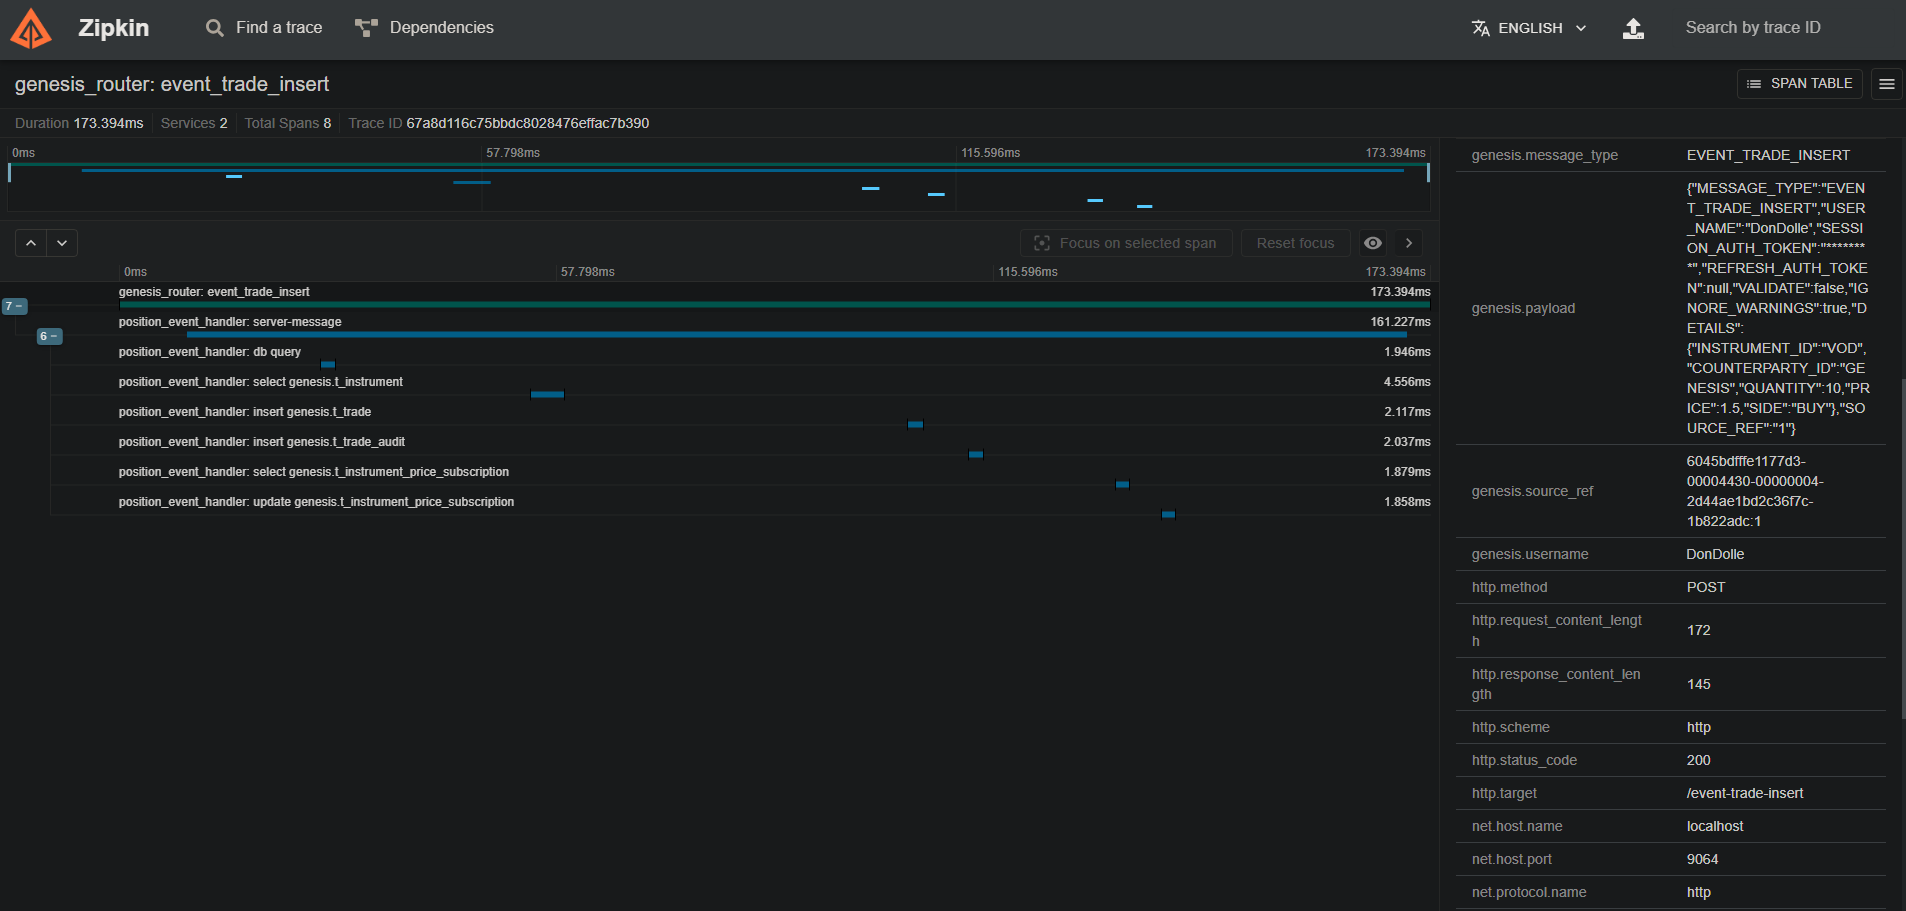
Below are a few screenshots of traces captured in a test Genesis application, viewed in Zipkin:
HTTP Login event:
WebSocket Req Rep message:
HTTP Insert event:
Messages across multiple services: