G2Plot Chart datasource
The chart-datasource component serves as the data provider for G2Plot charts, allowing for dynamic, server-driven data integration.
It is designed to fetch, filter, and structure data in real time from a back-end server, ensuring that the chart remains updated with the most recent data available. This makes it ideal for interactive and data-intensive applications, where live data updates are essential.
You can control how data is fetched, filtered, structured, and visualized, ensuring that your charts are both dynamic and efficient.
-
Configurable Data Fields. The
chartFieldsandserverFieldsproperties enable you to map data to chart axes and categories, making it easy to define which data should be represented as x/y fields or series values. -
Real-time Filtering. The
criteriaproperty enables the client to send expressions to filter data directly on the server, enabling efficient data handling without needing to re-fetch unnecessary information. -
Grouping and Stacking Options. Properties such as
isGroupandisStack, enable you to define whether data should be grouped by categories or stacked. -
Sorting and Ordering. The
orderByandreverseoptions provide control over data order, ensuring that charts can display information in a logical and user-friendly sequence. -
Snapshot. By setting
isSnapshot, you can specify whether the data is retrieved as a single snapshot or it is continually updated. -
Row Limits and Data Management.
maxRowsmanages the volume of data fetched, androwIdallows for unique row identification, so you can organise data flow for high-volume datasets.
Examples
Using chart-datasource with G2Plot chart
Below we have a simple example of a configuration for a chart with datasource for Genesis Component syntax.
- Chart configuration:
chartConfiguration = {
        xField: 'groupBy',
        yField: 'value',
    };
- Below is the declaration of a chart that uses the above configuration. The chart type is
column. It uses thechart-datasourcecomponent to retrieve two fields from theALL_STOCKSresource: SYMBOL (x axis) and TRADING_VOLUME (y axis).
<rapid-g2plot-chart type="column" :config=${(x) => x.chartConfiguration}>
    <chart-datasource
        resourceName = "ALL_STOCKS"
        server-fields = "SYMBOL TRADING_VOLUME"
    ></chart-datasource>
</rapid-g2plot-chart>
- The example below configures a stacked bar chart using the
isStack: truesetting in the .template.ts file for the page.
chartConfiguration = {
    xField: 'groupBy',
    yField: 'value',
    seriesField: 'series',
    isStack: true,
};
- You can then declare the bar chart in the
.tsfile for the page. This example displays data for three fields in the EXAMPLE_RESOURCE in the database - which could be a table or a view.
<rapid-g2plot-chart type="bar" :config=${(x) => x.chartConfiguration}>
    <chart-datasource
        resourceName = "EXAMPLE_RESOURCE"
        server-fields = "YEAR TRADING_VOLUME CATEGORY"
    ></chart-datasource>
</rapid-g2plot-chart>```
Here is the stacked bar chart that is rendered on the front end:
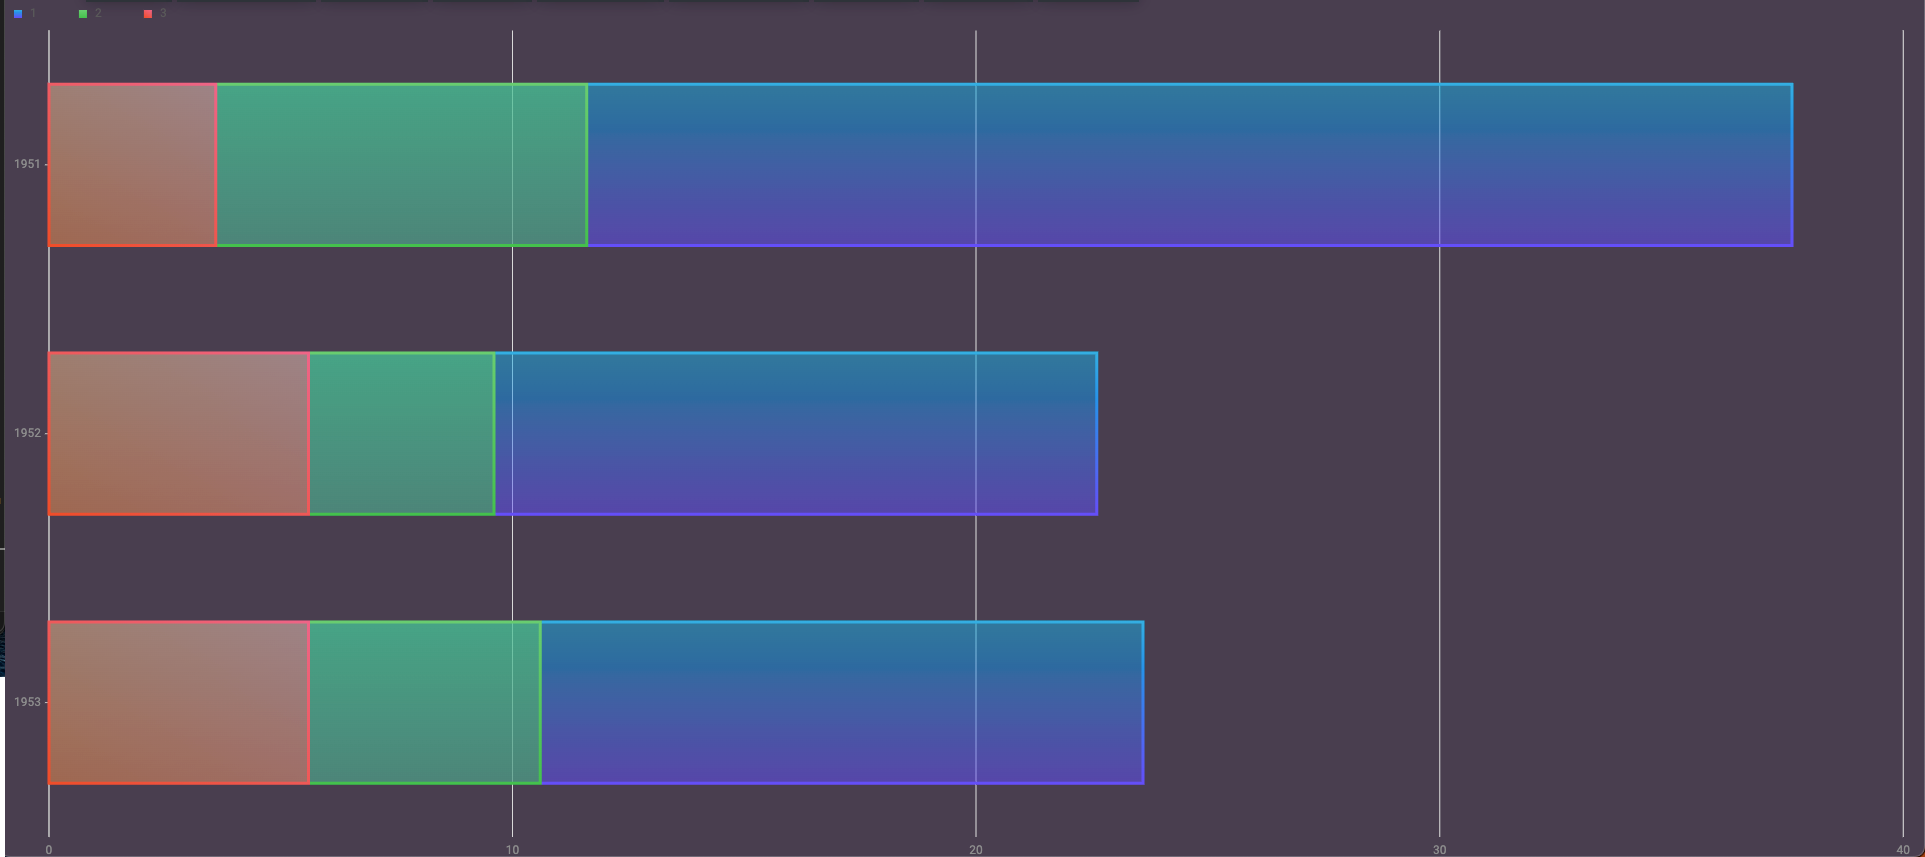
In this stacked bar chart, three years are displayed as bars, and each year has trading volumes for three categories of data.
The chart groups (stacks) these categories for each year into a single bar, with each category displayed in a different colour.
After you have looked at the basics here, you can find more details in our API Docs