Genesis Console - microservices
This screen enables you to view all the processes (microservices) that are running. The services are listed on the left of the page.
By default, the list shows all the processes in the application. The processes are organised into packages, and you can select a package from the top of the list to see only the processes in that package. For example, here we have selected the processes for the FIX package:
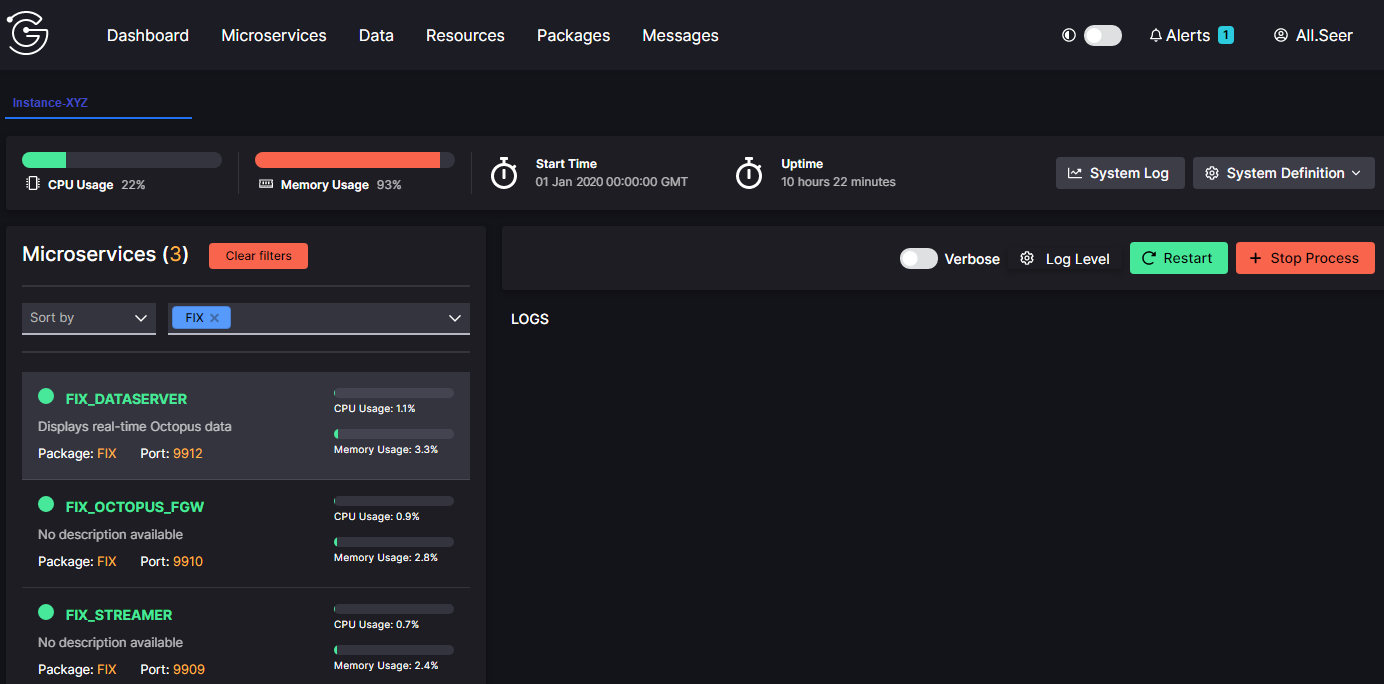
For each process, the list shows a description (if you have supplied one in the application), the package it belongs to, the port it uses, and the percentage of CPU it is using.
Note that you have useful information above the main part of the display:

- CPU usage for the application
- Memory usage for the application
- Start time
- Uptime
To the right of this, you can do two things:

-
View a system log. This displays the log for the whole application in the lower right of the screen. You can search through the log, clear it (remove all log entries) or stop logging. The button on the right enables you to download the current log contents.
-
View the system definition. This is displayed in the lower right of the screen. It includes information such as the database technology (FDB, MSSQL, Oracle or Postgres).
Viewing a log
You can click on a process in the list to see more details of it in the main panel. The main panel usually has tabs. Here, for example, we have selected GCOM as the Package, and we have clicked on the GCOM EVENT_HANDLER. We are currently looking at the LOGS.
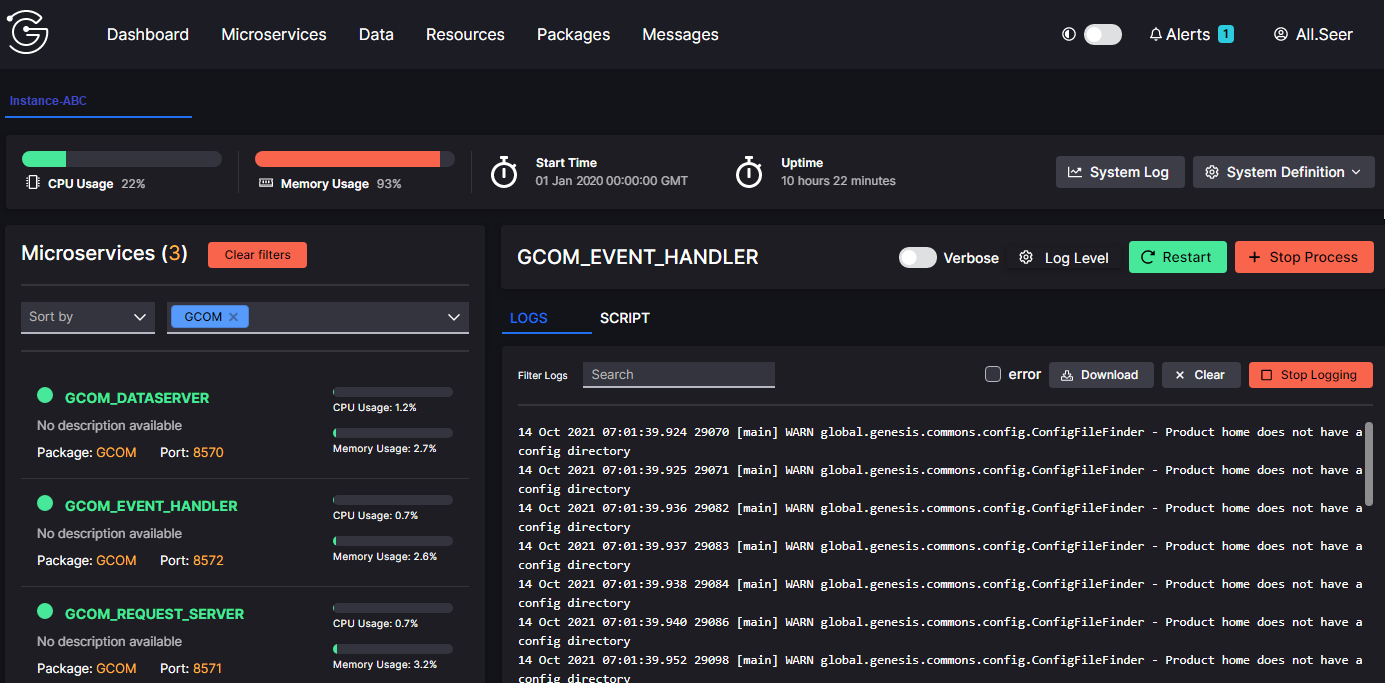
The process you have selected is clearly named at the top of the main panel. To the right of this are some control buttons that affect this process only:
- Verbose switches the
loggingLevelfor the process toDATADUMP_ON. This means that every single network message - including every event - will be recorded in the log. This is useful for troubleshooting. - Log level enables you to view or change the logging level. Trace is the most detailed logging level, showing virtually all types of message. Debug shows fewer message types. Info, Warn, and Error show progressively fewer message types. Importantly, you can set the time for the logging level to run for: 30 seconds, 3 minutes or 10 minutes. Logging files can be massive, so these are useful limits.
- Restart enables you to stop and restart the process. Use this with care.
- Stop process enables you to stop the process. Again, you need to use this with care. Once you have stopped the process, the button changes to Start Process.
There is another set of buttons immediately beneath these controls, where you can:
- Select error to view only messages of the type ERROR. You can switch this off or on.
- Click on Download to download the current log file.
- Click on Clear to clear the current log file (all log messages are removed).
- Switch logging off or on.
Above the log itself, Filter Logs simply enables you to search through the log for specific items.
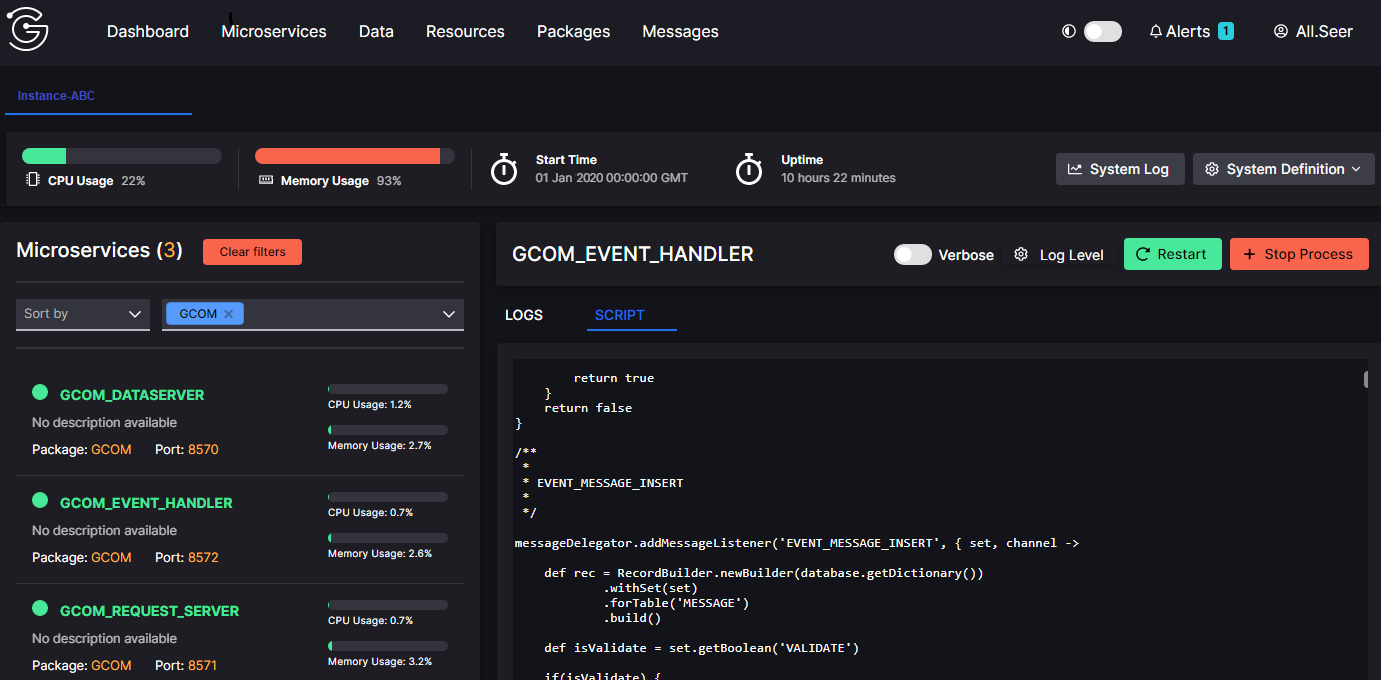
Viewing code
The other tab in the main panel is Script. You can click on this tab to view the code for this process.
You can scroll down to find specific code blocks and examine them.